http://www.mathworksheetscenter.com/mathtips/datagraphs.html
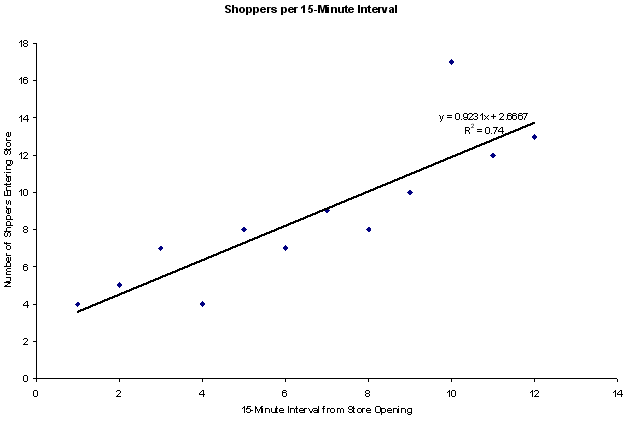
Scatterplots represent a function of two variables plotted on a 2 dimensional axis. The x-axis is the independent variable and the y-axis is the response or dependent variable. In this scatterplot, the number of shoppers entering a store are plotted against 15-minute intervals from the opening time of a store. The graph has a positive correlation showing an increase in shoppers as time increases from the opening of the store. The solid black line is known as a trend line representing the "best fit" of the two variables. The r-squared value is an index for the correlation of the two variables. In this graph, a 74% correlation exists between the number of shoppers increasing after the opening time of the store.

No comments:
Post a Comment