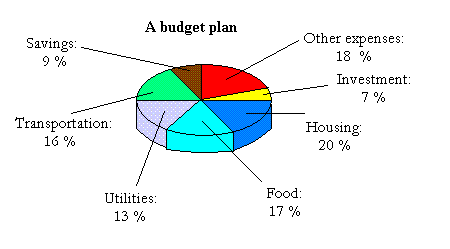
Circle Graphs or pie-charts are efficient methods of graphing proportionally. In this graph, a current budget plan is graphed to designate different expenses in hopes of managing money more effectively. All circle graphs will summate to 100% and can be used to show simple relationships such as political party or area land use.

No comments:
Post a Comment