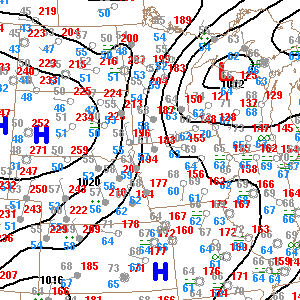
Isobar maps depict differential masses of pressure. This is extremely useful for visualizing and describing weather patterns in a given area. This graph shows the low pressure air mass forming over Lake Michigan and how its interacting with the local high pressure masses. The isolines show areas of equal pressure across the gradient. These maps can be used to predict future weather patterns.

No comments:
Post a Comment